
In today’s data-driven organizations, managing projects individually is no longer enough. Leaders need a portfolio-level view to ensure investments align with strategy, resources are optimized, and risks are visible early. This is where a Project Portfolio Management (PPM) Dashboard becomes a powerful decision-making tool.
A well-designed PPM dashboard transforms scattered project data into clear, actionable insights, enabling executives and PMOs to make informed strategic decisions rather than reactive ones.
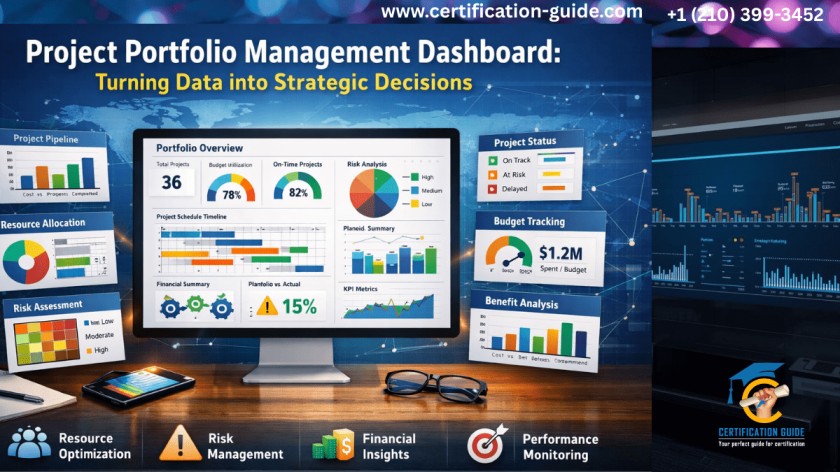
What Is a Project Portfolio Management Dashboard?
A Project Portfolio Management Dashboard is a centralized visual interface that consolidates data from multiple projects and programs across an organization. Instead of focusing on task-level details, it provides a high-level, strategic view of:
- Project performance
- Financial health
- Resource utilization
- Risks and dependencies
- Strategic alignment
The goal is simple: help leadership decide which projects to start, continue, pause, or stop.
Why Project Portfolio Management Dashboards Matter for Strategic Decision-Making
Without a PPM dashboard, organizations often face:
- Conflicting priorities
- Resource overload
- Budget overruns
- Poor visibility into risks
- Projects that don’t support business goals
A PPM dashboard solves these issues by enabling leaders to:
- Compare projects objectively
- Align initiatives with business strategy
- Maximize ROI across the portfolio
- Respond quickly to changing market conditions
In short, it connects execution with strategy.
Key Components of an Effective Project Portfolio Management Dashboard
A high-impact Project Portfolio Management Dashboard focuses on the right metrics—not just more data.
1. Strategic Alignment Indicators in a Project Portfolio Dashboard
Shows how each project supports organizational goals such as growth, compliance, innovation, or cost optimization.
Examples:
- Strategic objective mapping
- Priority scoring
- Value vs. effort analysis
2. Financial Performance Metrics in Project Portfolio Management Dashboards
Helps leaders understand where money is being spent and what value is being generated.
Common metrics include:
- Planned vs. actual budget
- Forecasted ROI
- Cost variance
- Benefit realization tracking
3. Schedule and Delivery Health Across the Project Portfolio Dashboard
Provides an overview of timeline performance across the portfolio.
Visuals often include:
- RAG (Red-Amber-Green) status
- Milestone tracking
- Slippage trends
- Critical path alerts
4. Resource Utilization and Capacity Planning in Portfolio Management Dashboards
One of the most valuable sections of a PPM dashboard.
It answers questions like:
- Are teams overallocated?
- Do we have capacity for new initiatives?
- Where are skill gaps?
This supports smarter workforce and hiring decisions.
5. Risk & Dependency Overview
Instead of managing risks project by project, a PPM dashboard highlights portfolio-level risks.
Includes:
- High-impact risks
- Cross-project dependencies
- Compliance or regulatory exposure
- Risk heat maps
Benefits of Using a PPM Dashboard for Strategic Decisions
A dashboard is only valuable if it drives action. Here’s how organizations use PPM dashboards strategically:
Prioritizing the Right Projects
By comparing value, cost, risk, and alignment, leaders can confidently:
- Greenlight high-value initiatives
- Defer low-impact projects
- Eliminate redundant efforts
Optimizing Resource Allocation
PPM dashboards reveal where resources are stretched or underutilized, enabling:
- Better workload balancing
- Smarter hiring decisions
- Reduced burnout and attrition
Improving Portfolio Agility
When market conditions change, leaders can quickly assess:
- Which projects can be paused
- Which initiatives should be accelerated
- How changes impact the overall portfolio
Best Practices for Building a PPM Dashboard
To ensure your Project Portfolio Management Dashboard delivers value:
- Focus on decision-centric metrics, not vanity data
- Keep visuals simple and executive-friendly
- Use consistent definitions across projects
- Automate data collection where possible
- Review and refine dashboards regularly
Remember: clarity beats complexity.
Tools Commonly Used for PPM Dashboards
Organizations use a variety of tools depending on scale and maturity, such as:
- Enterprise PPM software
- Business intelligence platforms
- Integrated project management tools
- Custom dashboards built on data warehouses
The tool matters less than how well it supports strategic conversations.
Why PPM Dashboards Are a Core Skill for Project Leaders
For project managers and PMO professionals, understanding PPM dashboards is no longer optional. It’s a critical skill for:
Modern project leadership is about influencing strategy, not just delivering tasks.
Final Thoughts: From Data to Decisions
A Project Portfolio Management Dashboard is more than a reporting tool—it’s a strategic asset. When designed and used effectively, it enables organizations to turn complex data into clear insights, align projects with business goals, and make confident, forward-looking decisions. In an environment where resources are limited and expectations are high, PPM dashboards help leaders answer the most important question:
Are we investing in the right work at the right time?