
Tracking project progress doesn’t have to be complicated. While detailed schedules, Gantt charts, and task lists are important, they can quickly become overwhelming—especially for stakeholders who only need a high-level view. This is where a milestone chart in project management becomes an incredibly effective tool.
A milestone chart highlights key achievements in a project timeline, helping teams and leaders quickly understand where the project stands and what’s coming next.
What Is a Milestone Chart in Project Management?
A milestone chart is a visual representation of major project events or checkpoints. Instead of showing every task, it focuses only on significant deliverables or decision points that indicate meaningful progress.
Milestones typically represent:
- Phase completions
- Key approvals or sign-offs
- Critical deliverables
- Major handoffs between teams
In simple terms, a milestone chart answers one key question:
“Are we hitting the important points in the project on time?”
Why Milestone Charts Are So Effective
Milestone charts are popular because they simplify complex project information without losing clarity.
Key Benefits of Using a Milestone Chart in Project Management
- Clear progress visibility – Instantly shows what’s completed and what’s next
- Stakeholder-friendly – Easy for executives and clients to understand
- Better alignment – Keeps teams focused on critical outcomes
- Early issue detection – Missed milestones signal potential delays
- Supports decision-making – Helps leaders take timely corrective actions
For PMP® professionals, milestone charts also align well with PMI® best practices for schedule and communication management.
Milestone Chart vs Gantt Chart: What’s the Difference?
While both tools are used to track timelines, they serve different purposes.
| Milestone Chart | Gantt Chart |
| High-level view | Detailed task-level view |
| Shows key events | Shows tasks, durations, dependencies |
| Ideal for leadership updates | Ideal for execution planning |
| Simple and clean | More complex and detailed |
👉 Many successful project managers use both: Gantt charts for execution and milestone charts for communication.
Key Elements of a Milestone Chart
An effective milestone chart usually includes:
- Milestone name (e.g., Design Approval, UAT Complete)
- Planned milestone date
- Actual completion date
- Status indicator (On Track, At Risk, Delayed)
- Owner or responsible team
These elements ensure the chart communicates both progress and accountability.
How to Create a Milestone Chart (Step by Step)
Creating a milestone chart is straightforward.
Step 1: Identify Key Milestones
Select milestones that represent major achievements—not routine tasks.
Step 2: Sequence the Milestones
Place them in chronological order along the project timeline.
Step 3: Assign Dates
Set realistic planned dates based on your project schedule.
Step 4: Track Progress
Update milestone status regularly as the project moves forward.
Step 5: Communicate
Share the milestone chart during status meetings and stakeholder reviews.
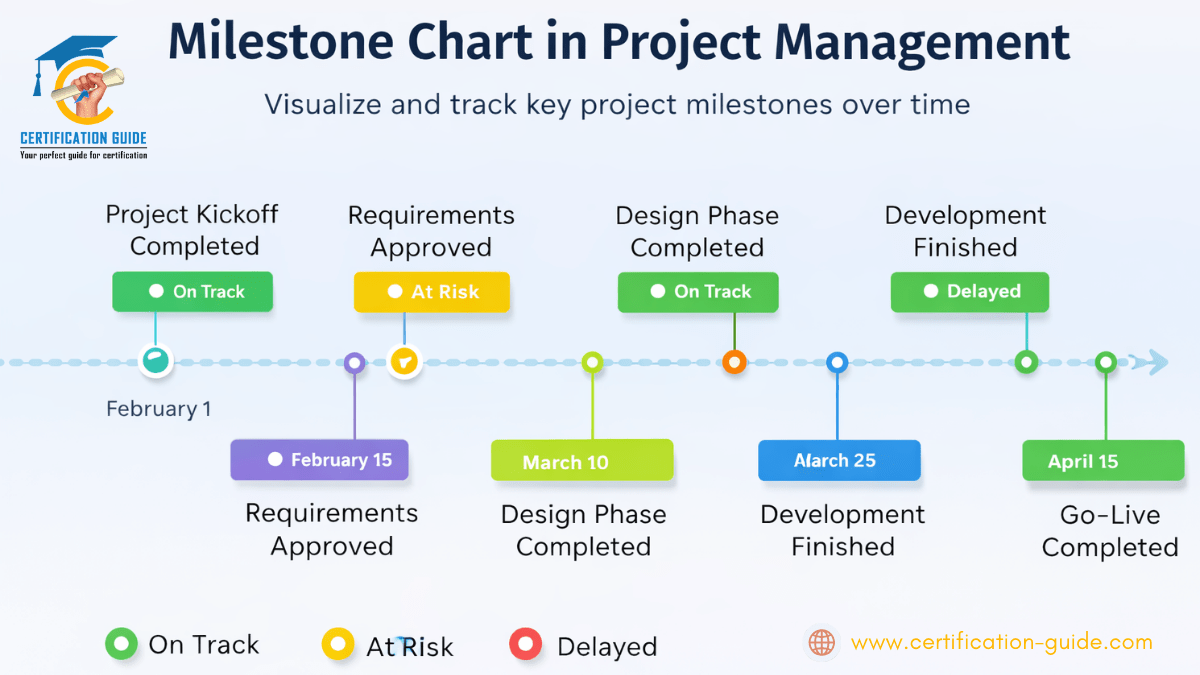
Common Examples of Project Milestones
Here are a few real-world examples:
- Project kickoff completed
- Requirements approved
- Design phase completed
- Development finished
- User acceptance testing (UAT) approved
- Go-live / launch completed
These milestones clearly signal progress without overwhelming details.
Best Practices for Using Milestone Chart in Project Management
To get the most value from milestone charts:
- Keep the number of milestones limited (quality over quantity)
- Align milestones with business outcomes
- Review milestone status regularly
- Use visual indicators for quick understanding
- Avoid turning milestones into task lists
Remember: milestones represent outcomes, not activities.
Tools Commonly Used to Create milestone chart in project management
Milestone charts can be created using:
- Project management software (MS Project, Smartsheet, Primavera)
- Agile tools with roadmap views
- Spreadsheets for simple projects
- Presentation tools for executive reporting
The tool matters less than the clarity of the information.
Why milestone chart in project management Matter for PMP® Aspirants
For PMP® exam preparation, milestone charts are closely tied to:
- Schedule management
- Stakeholder communication
- Performance monitoring
- Predictive and hybrid project environments
Understanding how and when to use milestone charts helps PMP® candidates apply concepts in real-world scenarios and exam questions.
Final Thoughts
A milestone chart in project management is one of the simplest yet most powerful ways to track and communicate project progress. By focusing on what truly matters—key achievements—it brings clarity, alignment, and confidence to project teams and stakeholders alike.
If you want a clear snapshot of project health without drowning in details, a milestone chart is the tool to use.
🎯 Want to Learn More about milestone chart in project management?
Master practical project management tools like milestone charts, scheduling techniques, and stakeholder communication as part of PMP® certification training designed for real-world success.